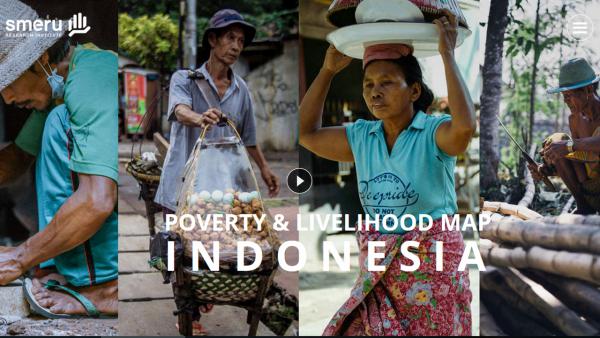
Poverty and Livelihood Map of Indonesia 2015
SMERU realizes that a lot of people move in and out of poverty over the course of time. Therefore, real-time and continuous updating of household welfare information is critical for the monitoring of the latest developments in the economy, as well as devising timely policy responses. To accommodate this, SMERU has taken up the challenge of updating the poverty map during intercensal periods. With support from the Ford Foundation, the update of small area estimations during the interval between censuses is conducted by combining the latest 2010 Population Census, 2010 Susenas, 2015 Susenas, and 2014 Podes.
In doing this, SMERU attempted to estimate the 2015 poverty figures of people in 2010 using counterfactual consumption data before applying small area statistics to estimate poverty rates down to the village level. The model used to estimate poverty rates in the Poverty and Livelihood Map of Indonesia 2015 is a provincial urban/rural model (totaled to 65 estimation models). Besides using the official provincial urban/rural poverty lines, SMERU also provides poverty figures based on internationally comparable lines that are referenced against the new US$3.1 (PPP) per person per day.
Data on livelihood indicators are also updated. In addition, the map also features qualitative information for selected villages. This is the very first effort to overlay poverty statistics with qualitative information and it is expected to facilitate improved poverty analyses for the users. For the time being, qualitative information is available for only 50 villages. We expect input from various stakeholders regarding qualitative information from other villages as well as data related to the livelihood conditions of the communities.
For more information, please contact povmap@smeru.or.id or visit povertymap.smeru.or.id.


