Highlights
-
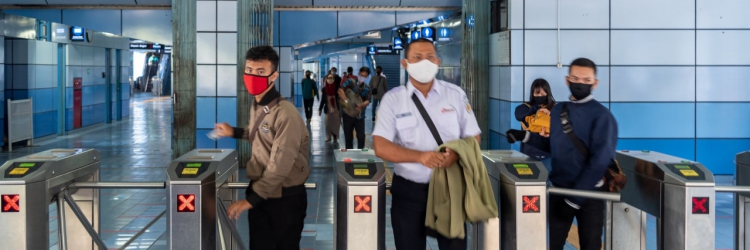
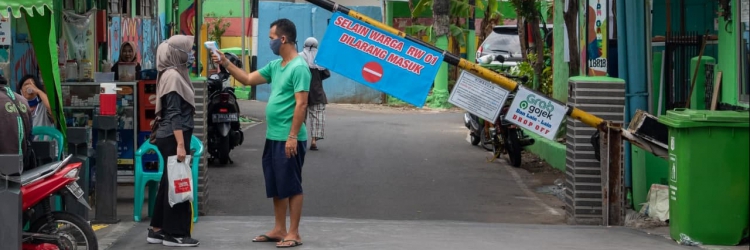
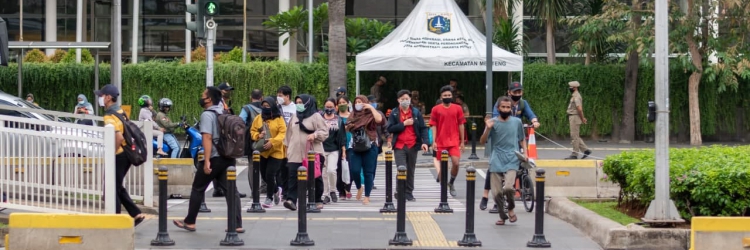
Indonesia’s COVID-19 daily case numbers continued to increase throughout 2020 and into early 2021 and was accompanied by the implementation of a social restriction policy.
-
The economy has not completely recovered to prepandemic levels.
-
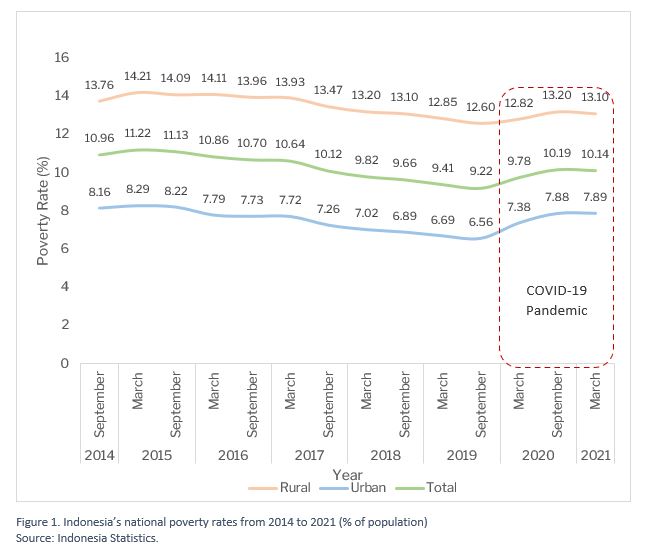
Indonesia’s poverty rate declined slightly from 10.19% in September 2020 to 10.14% in March 2021, but this rate is still higher than it was before the pandemic (9.2% in September 2019).
-
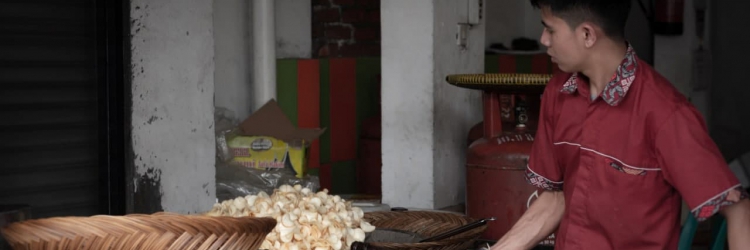
Households have used various coping mechanisms to meet their daily needs, such as selling assets or reducing expenditure.
-
Social assistance programs can ease the burden on households during crises resulting from the COVID-19 pandemic.
The COVID-19 Pandemic Is Not Over Yet
Indonesia has so far been unable to control the COVID-19 pandemic. Since the announcement of its first COVID-19 case in March 2020, reported daily cases have continued to increase during 2020 and through into 2021. From the current situation, it is clear that Indonesians cannot yet enjoy a full return to the living conditions experienced before the pandemic struck.
Indonesia's Economy Has Not Totally Recovered Yet
Indonesia’s economy has entered crisis state since the 2nd quarter of 2020. Two reasons are behind this crisis. First, increasingly more of the population (including those who are productive) are becoming infected with COVID-19. This lowers households’ ability to fulfill their daily needs, particularly for those directly affected by the COVID-19 pandemic. Second, the social restrictions imposed by the government have prevented the economy from operating at 100% of its full capacity with a number of businsses having to close down and workers be temporarily laid-off.
One indicator of the economic crisis is the economic growth rate. On 5 May 2021, Statistics Indonesia released a report that Indonesia’s economic growth rate in the 1st quarter of 2021 was -0.74%. The economic conditions during this period were much worse than before the pandemic, even though it showed improvement when compared to the economic situation in 2020. This indicates that Indonesia’s economy is still well below the normal rates of the period before the pandemic began. At the same time, the rate of growth of the per-capita national income (the measurement of national average welfare) also decreased by 3.15% in 2020. This indicated that there has been a decline in the level of household welfare in Indonesia in 2020 in comparison with 2019.
Poverty Rate Barely Changes
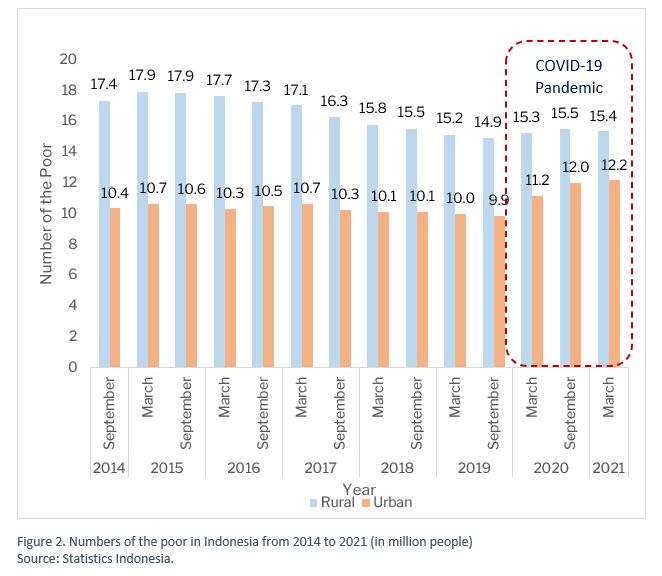
On 15 July 2021, Statistics Indonesia released a report that in March 2021, 10.14% or 27.54 million of the Indonesian population were categorized as poor. The poverty rate in March 2021 is slightly lower than that in September 2020 but still higher than the level of poverty before the pandemic in September 2019 (Figure 1).
Jika dilihat berdasarkan jumlah orang miskin, sejak September 2019 (kemiskinan terendah yang pernah dicapai Indonesia), jumlah orang miskin meningkat sebesar 1,12 juta individu dengan peningkatan terbesar terjadi di wilayah perkotaan sebesar 1 juta dan perdesaan sebesar 120 ribu orang (Gambar 2).
Since September 2019 (when the lowest poverty rate in Indonesia was at its lowesthas ever witnessed), their number of poor people has increased by 1.12 million individuals, with the greatest increase occurring in urban areas by 1 million individuals and rural areas by 120 thousand people individuals (Figure 2).
The decline in the level of household welfare (based on the per-capita expenditure) is due to, among other things, a decrease in household income. SMERU’s study[1] shows that the income of 75% of households decreased during the pandemic. As many as 66% of households owning small enterprises have also experienced a decrease in the number of buyers and rate of business turnover. Also, in August 2020, the unemployment rate increased by 2.7 million people. At the same time, the average wage for workers or laborers decreased by -5.2% from the average wage before the pandemic.
Welfare Rate Drops during the Pandemic
A household’s welfare can be measured, among other things, by its per-capita expenditure. This expenditure provides a clue on the household’s actual purchasing power or its ability to meet the cost of daily needs. Figure 3 shows the changes in household expenditure level (in %) for a period before the pandemic (September 2019) through to during the pandemic (September 2020). In Figure 3, households are ordered using 100 percentiles, where percentile 1 means the poorest and percentile 100 means the richest.
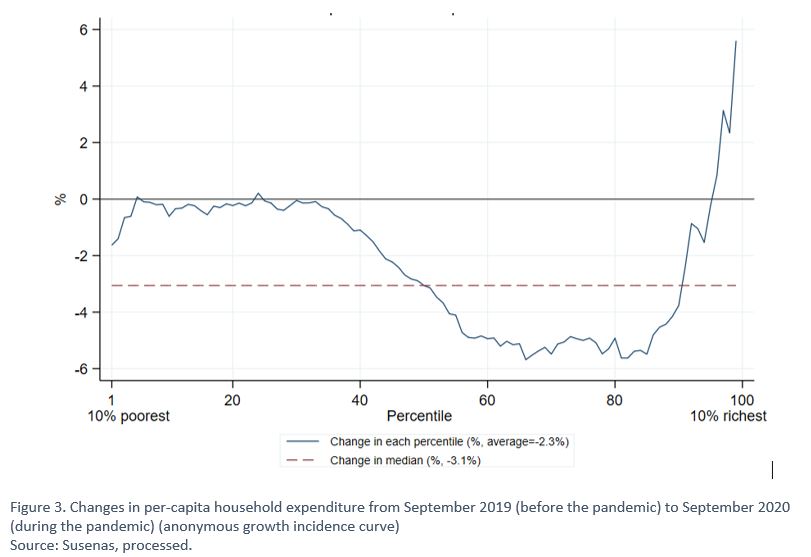
At the national level, it can be seen that the average expenditure of all households drops by -2.3% or at a median expenditure decrease of -3.1%. However, not every household experiences a decrease to the same extent. The expenditure of households within the 41th–95th percentiles on average decreases by -4%. For households within the 40th percentile and lower, the expenditure declines by -0.4%, whilst those within the 5th percentile and below experience a significant decrease of -1% to -1.6%. Meanwhile, during this period households in the 95th percentile and higher experience an increase in welfare levels of 2% to 5%.
When segregated by region, the trend seen in Figure 3 occurs in both urban and rural areas. However, the decline in household expenditure in urban areas is relatively higher than that in rural areas. This is because urban households are relatively more affected by the pandemic than households in rural areas.
Who Falls into Poverty, Who Rises to Higher Class?
To see which households fall below the poverty line, a set of data with two points of time for each household is needed. The households and individuals participating in the September 2020 Susenas and March 2020 Susenas are the same. Therefore, this data is representative of the changes in rank of an individual or household based on their welfare class. Welfare classes are divided into five groups, namely the poor, vulnerable, aspiring middle, middle, and upper classes (World Bank, 2019). Figure 4 shows the dynamic nature of changes in the welfare classes from March to September 2020 based on the number of individuals.
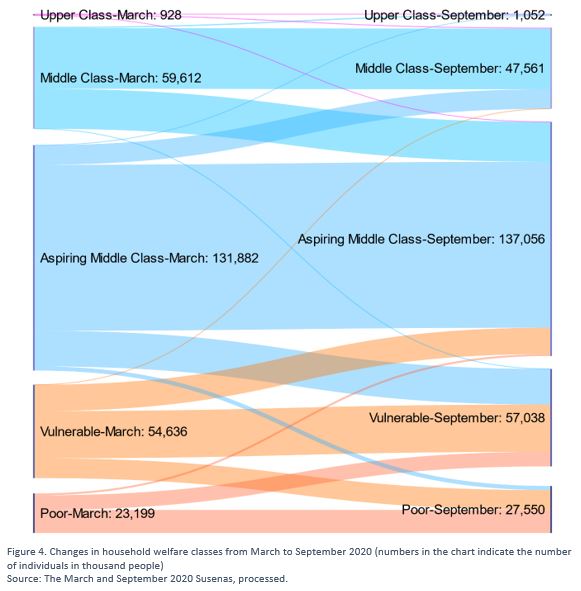
From Figure 4, it can be noted that the number of poor individuals increases from March to September 2020. Half of the individuals living in poor households in September 2020 are those who were below the poverty line in March 2020, whereas the remaining half were from vulnerable households in March 2020. The positive news is that 40% of individuals classified as poor in March 2020 successfully came out of poverty by September 2020, yet they only reached the status of vulnerable class. Half of those in the vulnerable class in March 2020 remained vulnerable in September 2020 and a quarter of them successfully climbed to the rank of aspiring middle class.
The middle class has its own dynamic. As many as 16% of the aspiring middle class in March 2020 were downgraded to the vulnerable class in September 2020, whilst 9% rose to the middle class in the same period. Meanwhile, 40% of the middle class fell into the aspiring middle class and only 1% of them climbed to the upper class, with the majority remaining in the middle class in September 2020. One-third of the upper class remained in the same class and two-third of them switch places with those from the middle class.
Coping Mechanisms Applied by Households during the Crisis
As indicated earlier, it is evident that the welfare level of most households in Indonesia declined during the crisis resulting from the COVID-19 pandemic. To make ends meet during the pandemic, households employ a number of strategies. Figure 5 specifies some of the coping mechanisms generally applied to deal with the decline in household welfare. Methods most commonly used by households to make ends meet include selling or pawning assets, reducing nonfood expenditure, borrowing money from relatives, and spending less on food items. Only 15% of households report that their daily needs are met.
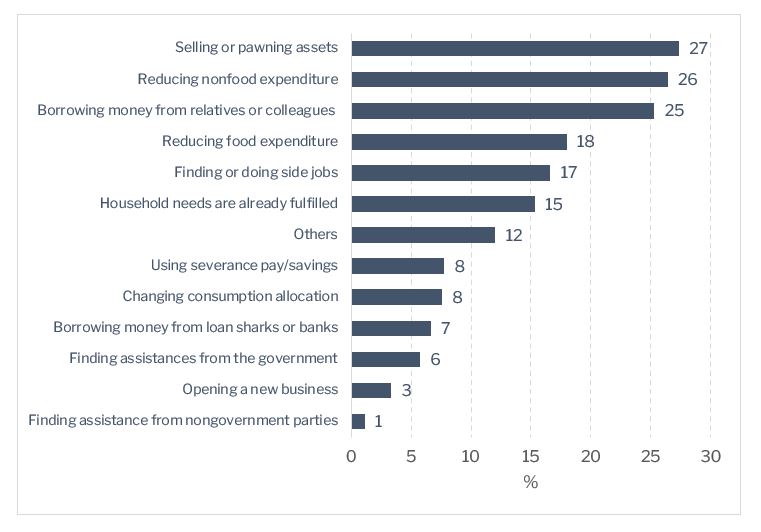
Figure 1. Several coping mechanisms applied since April 2020 for managing needs during the crisis. Source: The 2020 Household Survey.
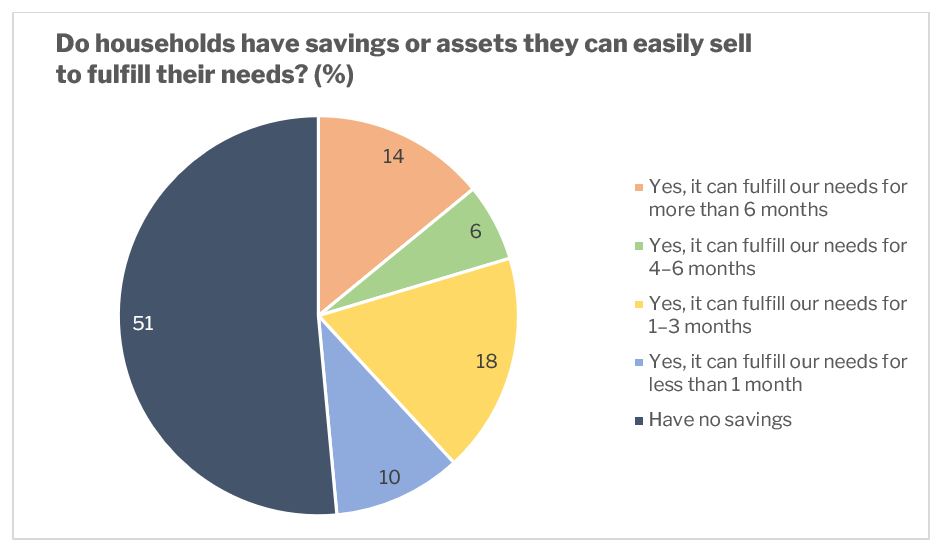
Many factors influence a household’s ability to deal with the crisis. One of these factors are whether or not they have savings (money that can be easily disbursed) or assets (goods that are easy to sell or pawn). Figure 6 shows the proportion of savings and asset ownership nationally. Up to 51% of households in Indonesia have neither savings nor assets. Meanwhile, 14% of households have savings to fulfill their needs for more than 6 months, 10% have savings for less than 1 month, and the rest have savings for 1–6 months.
Social Assistance to Reduce Expenditure Burden
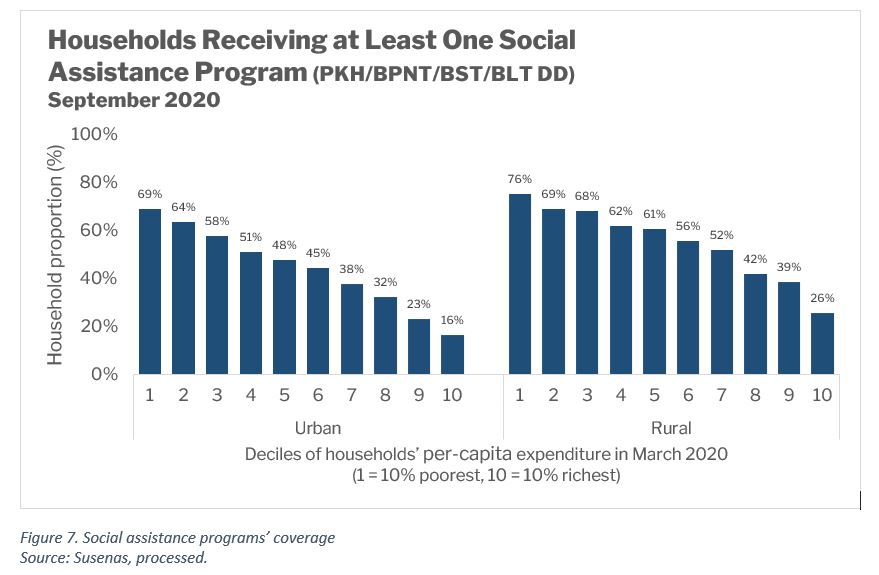
In addition to households relying on their own methods of coping, government assistance has been made available. In 2020 the government implemented a number of social protection programs in the form of both subsidy and cash, or social assistance, as a part of the National Economic Recovery Program (PEN). Results of the 2020 Household Survey show that 85% of households received at least one assistance program from the government. Meanwhile, 95% of households in the 20th percentile and below received assistance.[1]
Four major programs in the form of cash assistance, namely PKH, BPNT, BLT DD, and BST, are used in calculations when measuring the value of the assistance programs in terms of adequacy. These four programs cover at least 35 million or 50% of households.
Figure 7 shows the coverage of social assistance programs from the September 2020 Susenas data. As many as 69% of the poorest households in urban areas and 76% of the poorest households in rural areas receive at least one social assistance program. The proportion of poorer households as assistance beneficiaries is higher than that of richer households. This is because the social assistance programs target poor households.
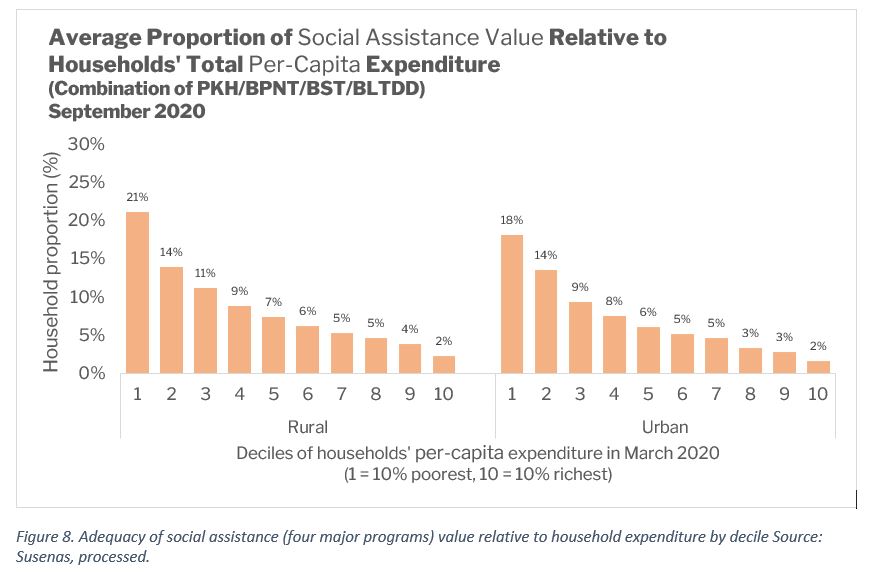
Meanwhile, Figure 8 shows the average adequacy of social assistance value relative to household expenditure based on the level of household expenditure decile in March 2020. If the four major cash social assistance programs are combined, the social assistance value is worth 21% of the poorest rural household’s total expenditure and 18% of the poorest urban household’s total expenditure. The richer the household, the relatively lesser the benefit proportion of the social assistance they receive. This indicates that the benefit of social assistance for poor households is relatively greater.
In addition, from the 2020 Household Survey, 67% of the assistance beneficiary households subjectively stated that the assistance they receive is highly beneficial. Among the beneficiaries of a combination of three or four programs, 80% to 86% of them reported the assistance they receive to be highly beneficial.
Challenge of Recovery
From the latest (status) reports (per 15 July 2021), conditions related to the COVID-19 pandemic in Indonesia show no evident signs of improvement. In response to the worsening situation, the Bank of Indonesia has even gone as far as to adjust its 2021 economic growth projection for the country from 4%–5% to 3.8%. One of the main steps the government has to take to control the pandemic is to accelerate the vaccination program at the national level. Also, social assistance is still desperately needed by the people to reduce household burden, particularly for poor households, in the midst of the current crisis.
Simply put, three steps can be taken by the government to improve the effectiveness of social assistance.
Firstly, the government can increase the assistance value. For example, the assistance amount could be increased from a monthly average of Rp300,000 per household in 2020 to Rp600,000 a month per household in 2021. In 2020, the average cash social assistance for the April–June period was actually Rp600,000 a month per household, but in the July–December period, the value was decreased to Rp300,000 monthly per household. This amount is inadequate considering that household burden has become even greater during this prolonged crisis. For comparison and consideration, the average national poverty line is Rp2,216,714 per month per household. To increase the value of assistance given, one program could be complemented or combined with other programs to improve the overall impact on household’s expenditure.
Secondly, the government can expand the coverage of existing social protection programs, particularly to include current poor and vulnerable households not yet covered by any program. Figure 7 shows that around 25%–30% of the 10% poorest households did not receive any social assistance program. The number of households currently not included in any program is also relatively large for the 40% poorest households. For this purpose, it is crucial to improve the database on poor and vulnerable households as well as those affected by the pandemic since a good database determines whether a program correctly targets its beneficiaries and is successful or not.
Finally, the government should ensure that social assistance benefits are distributed in a timely manner, particularly before the impact of the crisis is too great on households. Accurate targeting and timeliness are key to ensuring that these social assistance programs are effective in helping households deal with the decline in their welfare.
[1]UNICEF, UNDP, Prospera, and SMERU (2021) ‘Analysis of the Social and Economic Impacts of COVID-19 on Households and Strategic Policy Recommendations for Indonesia.’ Research Report. Jakarta: The SMERU Research Institute.
[2]UNICEF, UNDP, Prospera, and SMERU (2021) ‘Analysis of the Social and Economic Impacts of COVID-19 on Households and Strategic Policy Recommendations for Indonesia.’ Research Report. Jakarta: The SMERU Research Institute. The assistance programs included are Family of Hope Program (PKH), Food Staple Assistance/Non-Cash Food Assistance (BPNT), Direct Cash Transfer-Village Fund (BLT DD), Cash Social Assistance (BST), electricity subsidy, subsidy for workers paid under 5 million rupiah monthly, tax subsidy, internet package assistance, and instalment deferment.
Author(s)

SMERU's blog posts reflect the views of the authors and do not necessarily represent the views of the organization or its funders.